Every day in school districts across the country, countless stories are being written. Stories of students working toward their futures, building friendships, and persevering over obstacles. Stories of teachers inspiring students with the limitless possibilities of tomorrow, all while adapting to the constant changes of today. Stories of families placing their trust in public education to help prepare their children for the uncertainty ahead. Stories of communities rallying around shared values and supporting student passions in academics, the arts, and athletics. And stories of education leaders stretching limited resources to maximize outcomes and improve student experiences.
Districts themselves have compelling stories to tell as well, though leaders often lack the time to curate and communicate them, buried under the minutiae and daily stresses of operating complex public organizations. But what if those stories are already written and just waiting to be shared? What if we used our everyday data strategically to write a narrative that builds trust, guides design and investment, and creates a shared vision for the future?
Data storytelling matters because it connects the dots. For students, it means resources aligned with their needs and aspirations. For staff, it means facilities and programs designed to support their unique work. For families, it means confidence that their children are being prepared for what comes next. For communities, it means knowing their local school district is using its tax dollars efficiently and effectively.

Knowing What Makes Your District Stand Out
Every district has unique strengths, challenges, and community characteristics. Data can bring those differences into focus. Whether your district excels in producing college-bound graduates or your graduates are more interested in trades or enrolling in technical programs, both are valuable paths for students to pursue. But each pathway requires different investments in facilities and programming.
Demographic and enrollment trends also shape the story. Are more young families moving into the area, requiring additional classrooms, especially at the early childhood level? Has your district experienced dramatic shifts in enrollment due to schools of choice or employment changes in the community? Has your institution experienced an increased demand for certain specialized programming, creating new demands for flexible spaces?
Some districts find themselves maintaining more buildings than their peers to serve the same number of students, while others are growing so quickly that every available classroom feels full. In some cases, rising salary costs can make it difficult to invest in facilities, technology, or curriculum resources. Large geographic areas can stretch transportation programs thin, driving up costs simply because buses have farther to go. Even utility spending can quietly climb above benchmark values, increasing the overall cost of educating each student.
Every district’s story is different. The right combination of data points helps reveal what makes yours unique — where resources are stretched, where efficiencies can be gained, and where investment will have the greatest impact. Framing those realities within the proper context helps build a clear, compelling case for long-term improvements and smarter operations.
The districts that thrive in challenging times are the ones that use data strategically to guide decision-making and inspire action:
- Enrollment analysis helps leaders forecast needs based on demographic shifts, ensuring proactive planning for the future.
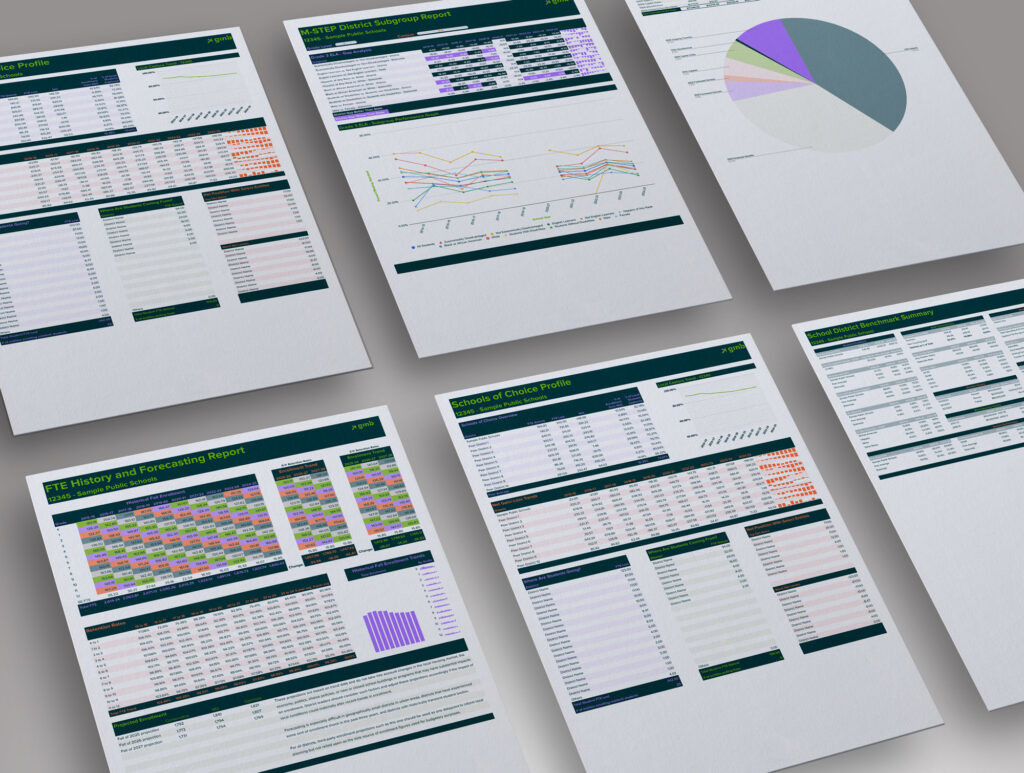
- Strategic reporting creates clarity around financials, enrollment, staffing levels, student outcomes, and other important district characteristics.
- Regular financial reporting can help create a shared language within a district’s community, making complex funding mechanisms like bonds, operating millages, and sinking funds easier for voters to understand when necessary.
Building the Case for Action
By weaving together public and proprietary datasets, GMB is helping education leaders and communities see the whole picture. The right measures highlight why investment matters and what benefits it can deliver. District leaders don’t have to piece together the puzzle alone. We are building new tools and reporting options unique to your district that can bring clarity to complex questions, such as energy benchmarking to demonstrate sustainability progress, facilities assessment reporting to prioritize needs, enrollment and demographic projections to forecast capacity, and post-project impact studies to show how investments improved learning and community well-being.
We help districts frame their individual story, back it up with credible data, and communicate it in ways that build alignment and confidence in a path forward.
Want to see how your district’s data stacks up? Reach out to a GMB project team member today to learn more.